Comprehensive Analysis of Gold Market Dynamics and Economic Factors
In-Depth Examination of Gold Prices Influenced by Economic Data, Federal Reserve Policies, and Geopolitical Tensions | That's TradingNEWS
Gold Market Analysis: Dynamics, Economic Factors, and Technical Insights
Impact of Economic Data on Gold Prices
Gold rallied more than 1% on Thursday following the release of economic data. The softer Greenback, which retreated after posting solid gains, contributed to the decline in US Treasury bond yields, supporting higher gold prices. XAU/USD traded at $2,326, recovering from a two-week low influenced by inflation figures from Canada and Australia.
The US Dollar Index (DXY), which tracks the dollar against a basket of other currencies, hit a new monthly high of 106.13 before erasing some gains, settling at 105.91, down 0.12%. US economic data showed a slight improvement with the GDP for Q1 2024 at 1.4% QoQ, higher than the forecast of 1.3%. Additionally, Durable Goods Orders in May rose by 0.1% MoM, surpassing the expected -0.1% contraction. Initial Jobless Claims also dipped from 239K to 233K, below the forecast of 236K.
Federal Reserve's Stance and Market Expectations
This week, the Federal Reserve's preferred inflation gauge, the May PCE, is expected to decrease from 2.7% to 2.6% YoY, while Core PCE is anticipated to decline from 2.8% to 2.6% YoY. Fed officials expressed mixed views, with Governor Michelle Bowman advocating for rate increases if disinflation stalls and San Francisco Fed President Mary Daly expressing concerns about the labor market. Fed Governor Lisa Cook indicated a likely sharp fall in inflation next year.
According to the CME FedWatch Tool, there is a 59.5% probability of a 25-basis-point rate cut in September, up from 56.3% last week. The December 2024 fed funds rate futures contract implies a 35 basis point policy easing by year-end.
Gold's Technical Analysis
Gold prices advanced but remain under the Head-and-Shoulders chart pattern, suggesting potential further declines if key support levels are breached. XAU/USD traded higher but stayed below the Head-and-Shoulders neckline, which, if broken, could lead to testing the June 21 high of $2,368. The Relative Strength Index (RSI) below the 50-midline indicates momentum favors sellers.
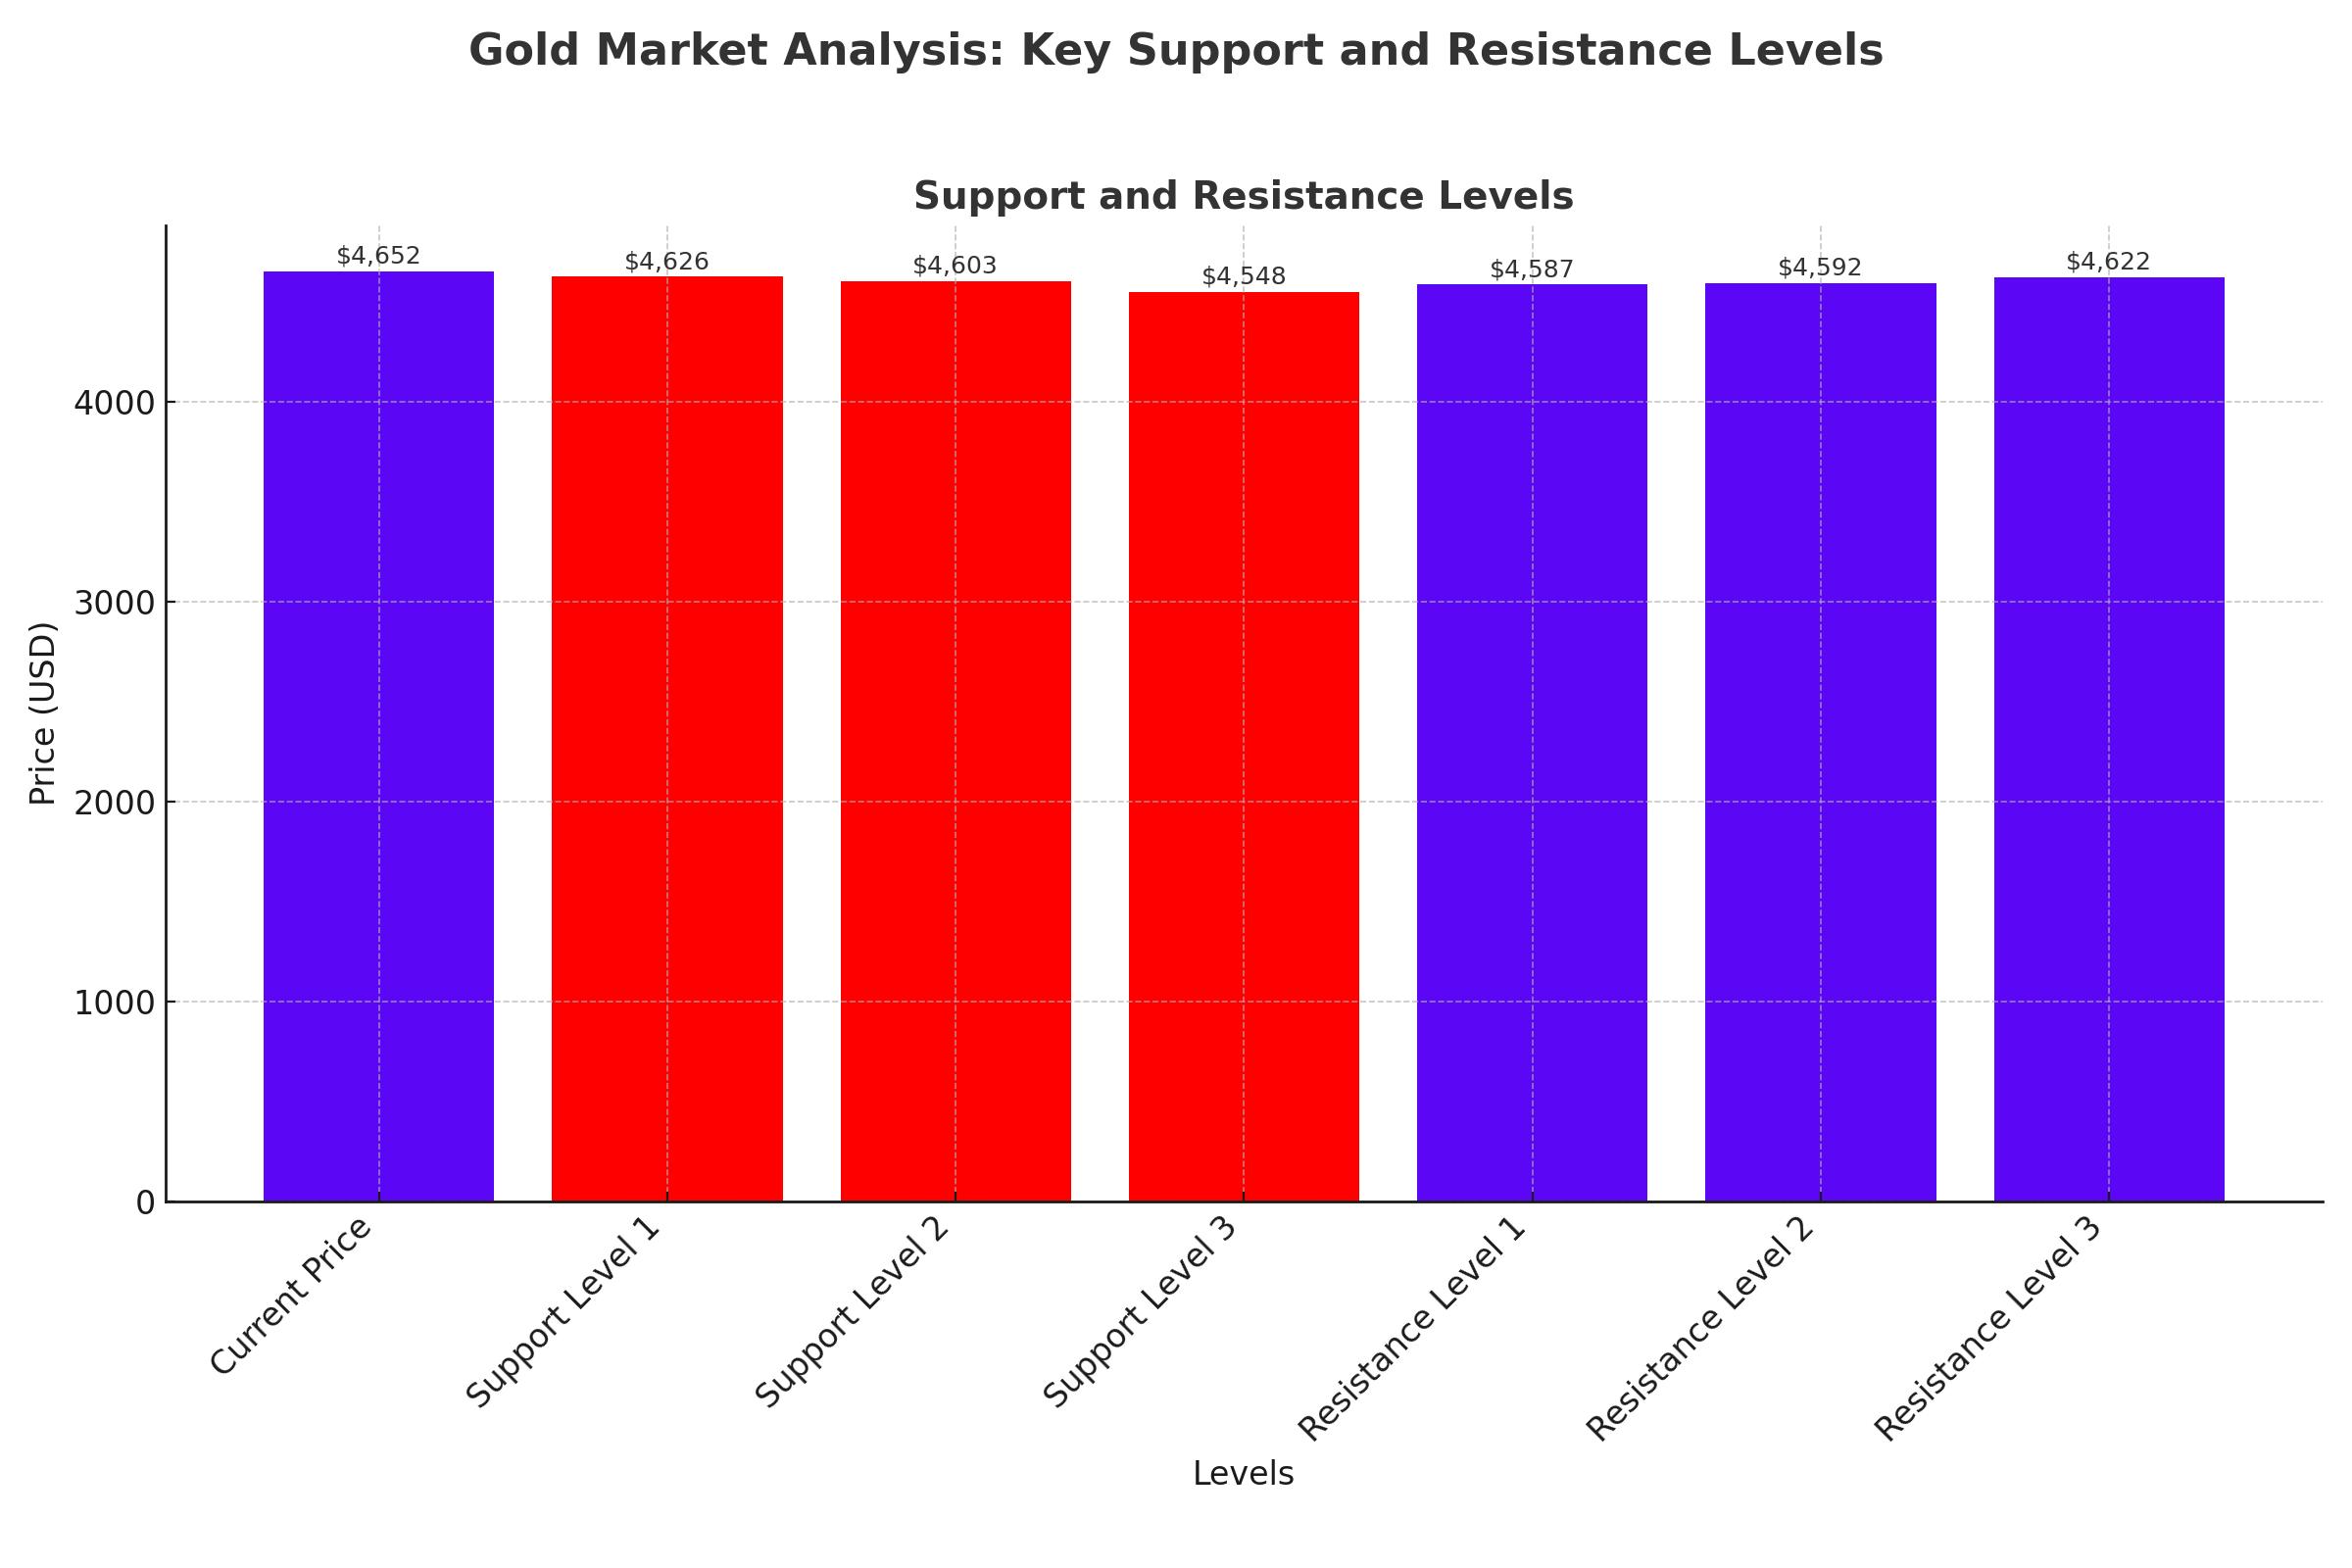
The next support for XAU/USD is $2,300, followed by $2,277 and the March 21 high of $2,222. If these levels are breached, the target could drop to $2,170 to $2,160. On the upside, reclaiming $2,350 would expose additional resistance levels like the June 7 cycle high of $2,387 and potentially challenge the $2,400 mark.

US Economic Indicators and Market Sentiment
Today's mixed US data, including an uptick in initial jobless claims and an upwardly revised GDP, add to market confusion regarding rate cut timings. The anticipation of PCE inflation data and end-of-quarter flows could induce market volatility. The Federal Reserve's rate cut probabilities for September are around 65.8%, slightly differing from Fed policymaker Rafael Bostic's expectations of a rate cut in Q4.
Geopolitical Tensions and Gold Prices
Geopolitical tensions, particularly between Israel and Hezbollah, continue to influence gold prices. The fear of an expanded conflict in the Middle East supports a price floor despite demand fluctuations. The US Presidential debate between Joe Biden and Donald Trump is expected to impact the US Dollar and subsequently gold prices. However, any volatility from the debate is likely to be short-lived.
Technical Outlook and Key Levels
Gold needs to find acceptance above $2,400/oz or below $2,300/oz for a definitive trend continuation. The break above the descending trendline suggests potential upside toward the $2,365-2,370 area. Resistance is provided by the 100 and 200-day MA around the $2,326 mark. A break above these levels could focus on $2,350 and $2,370. Conversely, a rejection from the MAs may lead to a retracement to the $2,300/oz level.
Market Analysis and Key Indicators
Gold rebounded, erasing the week's previous 1.2% drop against the Dollar as new US data indicated stronger inflation and weaker demand. New claims for jobless benefits slipped, but continuing claims rose to the highest level since November 2021. Despite higher inflation on Q1 GDP data, US interest-rate expectations edged lower.
Western stock markets and bond prices rallied, nudging longer-term borrowing costs down from 2-week highs. The US Dollar fell back from 2-month highs against major currencies. Gold surged to $2,322 per Troy ounce, rebounding from the previous day's decline below $2,300. Silver also rallied, erasing half of the week's previous drop.
US GDP grew at a 1.4% annualized pace in Q1, while the trade deficit in goods exceeded $100 billion. Durable goods orders excluding autos fell, and wholesale inventories rose, indicating weaker demand. Analysts at BMI noted that gold prices remain in a tug-of-war between a less-dovish Fed and high geopolitical tensions.
Conclusion
The gold market is currently navigating a complex landscape of economic indicators, geopolitical tensions, and technical factors. The interplay of these elements will continue to shape gold prices in the near term. Investors should remain vigilant, considering these multifaceted influences when making investment decisions. The anticipation of US inflation data and geopolitical developments will be crucial in determining gold's direction in the coming weeks.
That's TradingNEWS

WTI & Brent Crude Prices Face Major Setback: How Will Trump's Tariffs and OPEC+'s Output Boost Impact Oil Markets?

Gold Price Surges to Record Highs Before Retreating: How Will Tariff Uncertainty Affect XAU/USD?


