


NASDAQ:EXPE Stock - Expedia's Market Position and Future Growth
Expedia Group (NASDAQ:EXPE) Navigates Challenges with Strategic Adjustments and Financial Resilience | That's TradingNEWS
Analyzing NASDAQ:EXPE: An In-Depth Look at Expedia's Market Position and Future Potential
Current Market Position of NASDAQ:EXPE
Expedia Group, Inc. (NASDAQ:EXPE) is navigating a complex landscape as it strives to regain its footing post-pandemic. The stock has faced significant volatility, particularly following earnings releases that highlighted struggles within its vacation rental platform, Vrbo. Despite these challenges, the broader travel market's recovery and strategic adjustments within Expedia suggest potential for future gains.
Financial Performance and Valuation
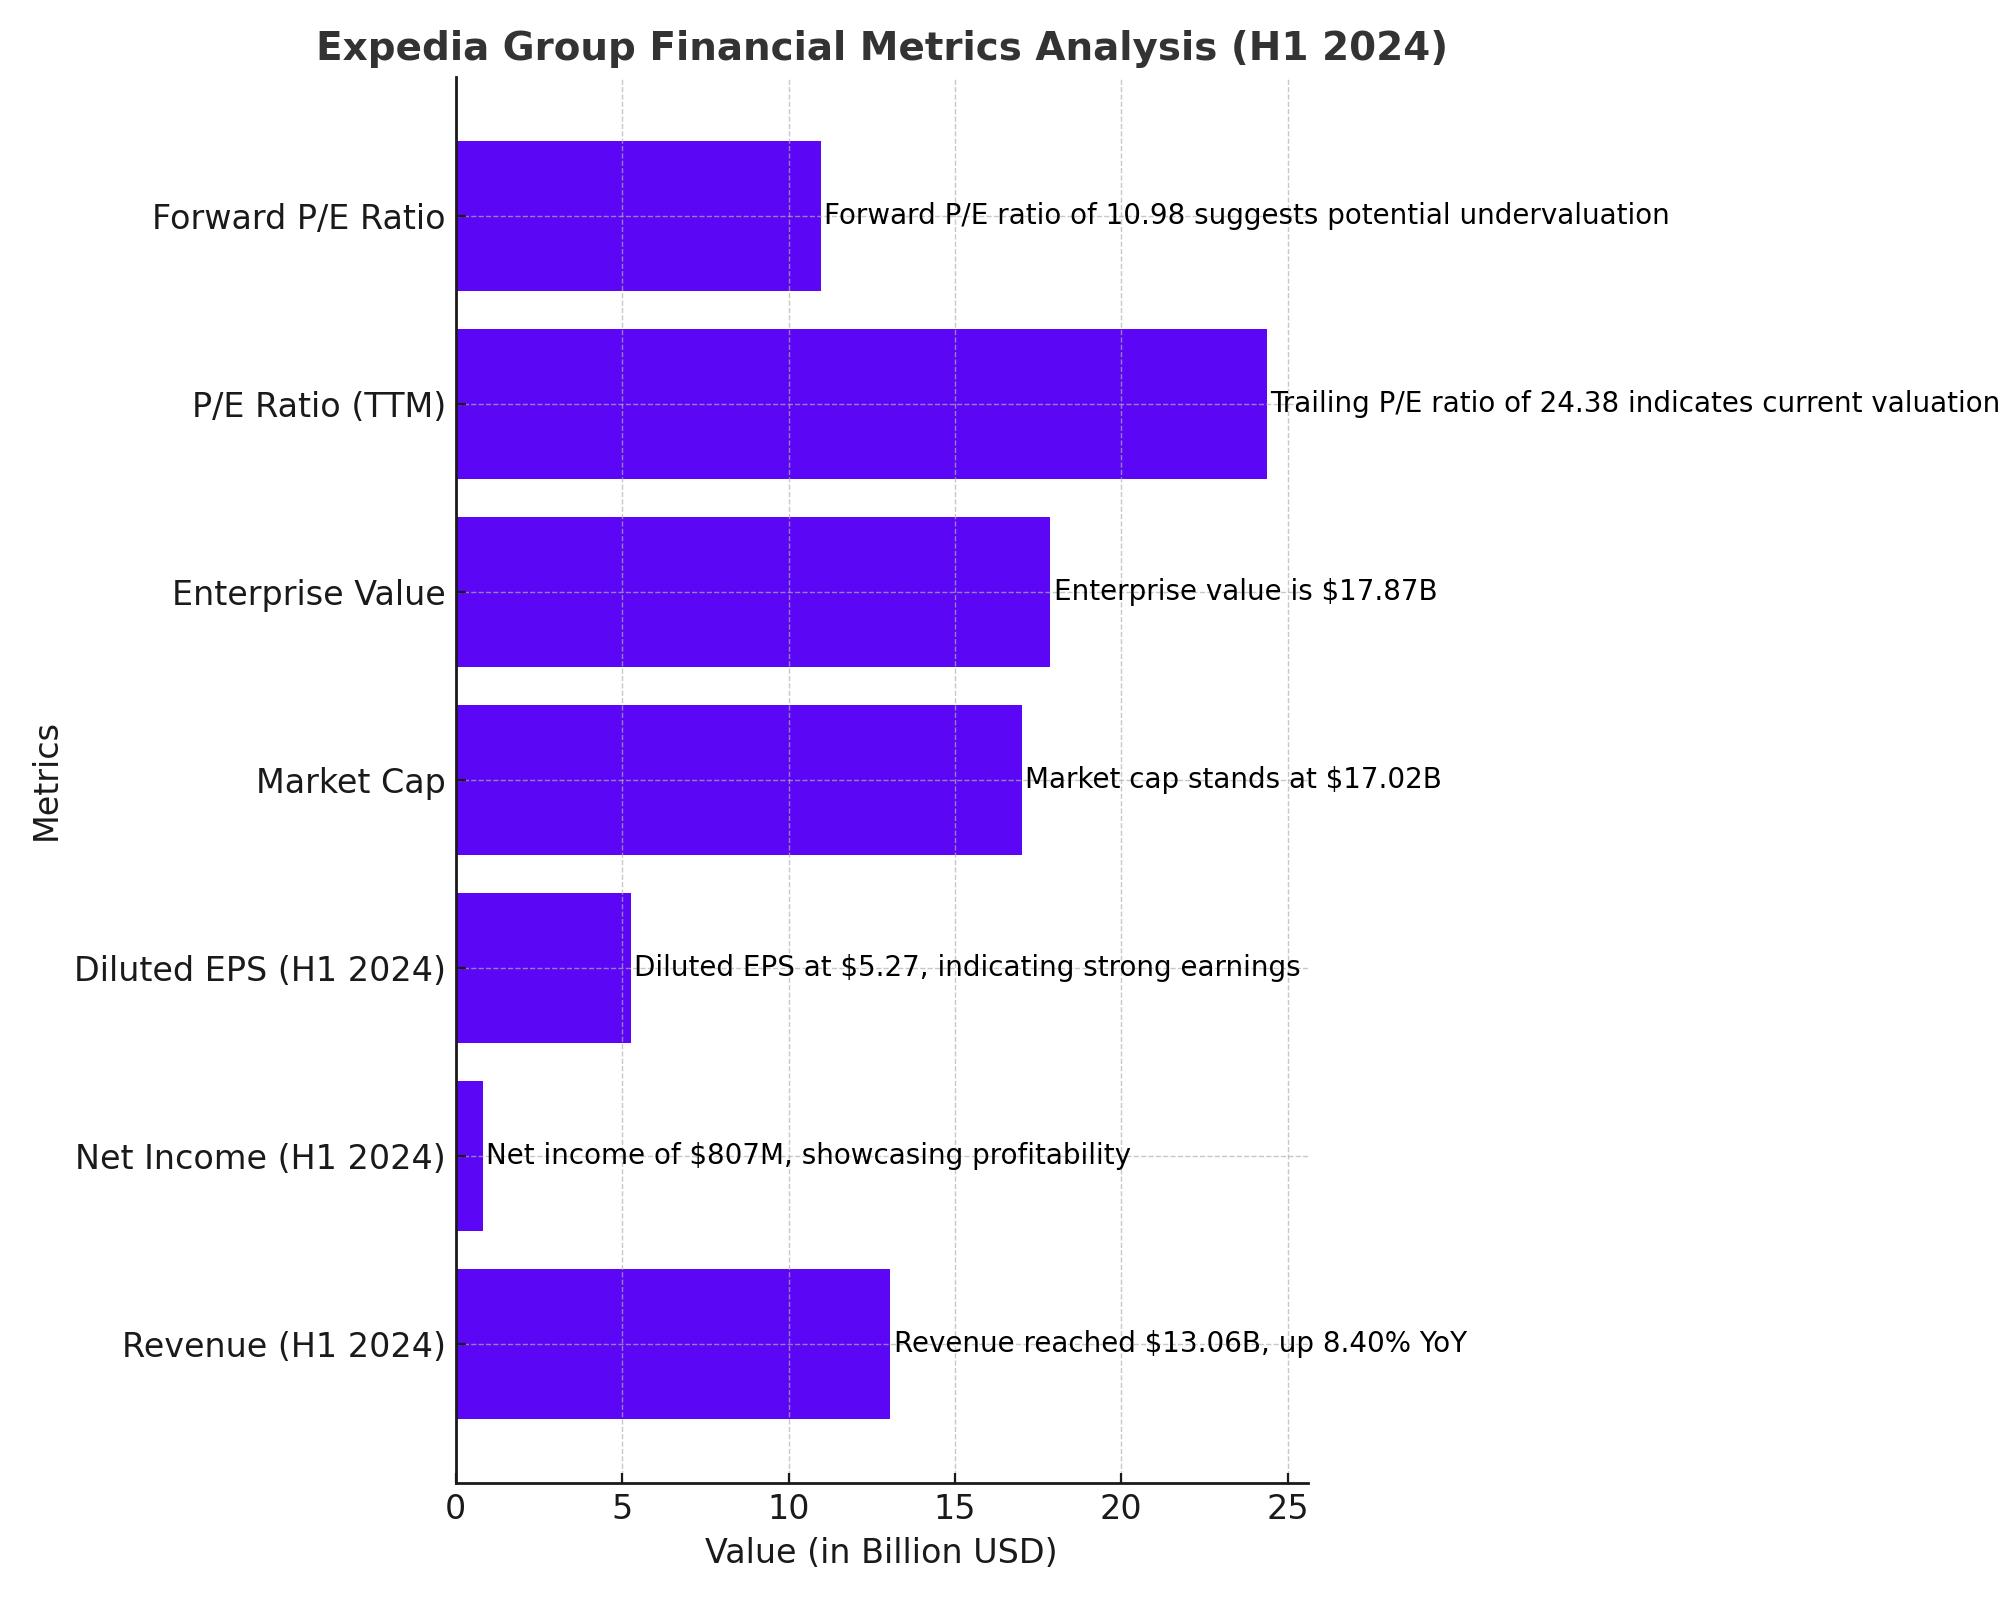
For the first half of 2024, NASDAQ:EXPE reported robust financial results, with revenues reaching $13.06 billion, marking an 8.40% year-over-year growth. The company's net income attributable to common shareholders stood at $807 million, with diluted earnings per share (EPS) at $5.27. Despite these positive figures, Expedia's trailing P/E ratio is 24.38, while the forward P/E ratio is a more attractive 10.98, indicating potential undervaluation compared to future earnings expectations.
Valuation Metrics (as of 3/31/2024):
- Market Cap: $17.02 billion
- Enterprise Value: $17.87 billion
- Price/Sales: 1.44
- Price/Book: 19.12
- Enterprise Value/Revenue: 1.37
Expedia's forward P/E ratio of 10.98 is notably lower than that of its primary competitors, suggesting a potentially undervalued stock relative to its growth prospects.
Impact of Vrbo on Earnings and Market Position
Expedia’s Vrbo platform has faced significant headwinds, contributing to a post-earnings slump. The technical migration and subsequent slower-than-expected ramp-up of Vrbo have been pivotal issues. During the Q1 2024 earnings call, outgoing CEO Peter Kern acknowledged these challenges, leading to a revised guidance for the year. Despite this, the company remains committed to investing in Vrbo and other international growth markets to drive long-term performance.
Comparison with Airbnb (ABNB):
- Vrbo has experienced slower growth, similar to the broader trends seen in the home-sharing market.
- Airbnb’s Q1 results showed a deceleration in nights and experiences booked to 9% year-over-year growth.
- Expedia reported 7% growth in booked room nights for the same period, indicating a slight edge over Airbnb in recovery momentum.
Strategic Layoffs and Profitability Initiatives
In February 2024, Expedia announced layoffs affecting 1,500 employees, approximately 9% of its workforce. This cost-cutting measure is part of a broader strategy to enhance profitability. Already, adjusted EBITDA margins have expanded by 190 basis points year-over-year to 8.8% in Q1 2024.
Key Financial Highlights:
- Adjusted EBITDA: $1.72 billion
- Operating Cash Flow: $2.41 billion
- Levered Free Cash Flow: $1.75 billion
- Total Debt: $6.56 billion
- Total Cash: $5.71 billion
These figures underscore the company’s efforts to streamline operations and improve financial health amidst a challenging market environment.
Market Comparisons and Competitive Positioning
When comparing NASDAQ:EXPE to its main competitors, Booking Holdings (BKNG) and Airbnb (ABNB), Expedia’s valuation and growth prospects stand out. BKNG enjoys a higher revenue and margin profile, reflected in its forward P/E ratio of 22.33. In contrast, ABNB’s forward P/E ratio is significantly higher at 33.79, suggesting less room for multiple expansions given its current market cap of $100 billion compared to Expedia’s $16 billion.
Market Dynamics:
- Expedia’s lower forward P/E ratio of 10.98 indicates potential for significant appreciation.
- The company’s focus on hotel bookings could shield it from some of the regulatory headwinds facing the short-term rental market, particularly in cities like Barcelona.
- The One Key rewards program is expected to drive customer loyalty and repeat bookings, enhancing long-term revenue growth.
Technical Analysis and Stock Performance
From a technical standpoint, NASDAQ:EXPE has shown resilience despite recent volatility. The stock has held higher lows following earnings-induced drops, with a notable recovery from the May 2023 low of $107.25. This support level has proven crucial in propelling the stock higher, with resistance levels at $140 and $160.
Technical Indicators:
- 50-Day Moving Average: $122.43
- 200-Day Moving Average: $129.82
- Recent Close: $128.49
The stock’s ability to maintain these support levels and recover from earnings-related declines suggests underlying strength and potential for continued upward momentum.
Revenue Growth and Future Projections for NASDAQ:EXPE
Expedia's performance and projections indicate a potential turnaround, especially given the broader recovery in the travel industry. Despite the challenges faced by Vrbo, the company’s overall revenue growth remains positive.
Revenue Estimates:
- Current Quarter (June 2024): Analysts estimate revenues at $3.53 billion, reflecting a 5.20% year-over-year growth from $3.36 billion in the same quarter last year.
- Next Quarter (September 2024): Expected revenue is $4.2 billion, a 6.90% increase from $3.93 billion in the prior year.
- Full Year (2024): Revenue projections stand at $13.79 billion, a 7.40% growth from $12.84 billion in 2023.
- Next Year (2025): Revenue is forecasted to reach $14.87 billion, showing a growth of 7.80%.
These estimates highlight a steady recovery trajectory, driven by strategic initiatives and a broader market recovery.
Earnings Per Share (EPS) Projections:
- Current Quarter (June 2024): The average EPS estimate is $3.05, compared to $2.89 in the same quarter last year.
- Next Quarter (September 2024): Expected EPS is $6.31, up from $5.41 in the previous year.
- Full Year (2024): Projected EPS is $11.68, an increase from $9.69 in 2023.
- Next Year (2025): EPS is forecasted to be $14.87, showing a significant growth from $11.68.
The positive earnings growth projections underscore Expedia's potential to enhance profitability as it navigates through the current market conditions.
Strategic Focus and Market Differentiation
Expedia's strategic focus on integrating its One Key rewards program and enhancing its hotel booking platform positions it uniquely within the competitive landscape. The One Key program, which offers effective cash-back incentives, is designed to drive customer loyalty and repeat bookings, providing a competitive edge over Airbnb, which lacks a similar loyalty program.
Competitive Position:
- Booking Holdings (BKNG): BKNG continues to lead in revenue and margins but is trading at a higher valuation, reflected in its forward P/E ratio of 22.33.
- Airbnb (ABNB): Despite higher revenue growth rates, ABNB's forward P/E ratio of 33.79 and market cap of $100 billion suggest a potential overvaluation compared to Expedia.
Expedia's lower forward P/E ratio of 10.98 and a focus on hotel bookings, which are less susceptible to regulatory pressures on short-term rentals, position it favorably for future growth.
Operational Efficiency and Cost Management
Expedia's decision to lay off 1,500 employees (9% of its workforce) earlier in 2024 is part of a broader effort to improve operational efficiency and profitability. These layoffs, combined with other cost management initiatives, are expected to enhance the company's bottom line.
Operational Metrics:
- Total Cash: $5.71 billion
- Total Debt: $6.56 billion
- Current Ratio: 0.79
These metrics indicate a strong liquidity position, allowing Expedia to navigate through short-term challenges while investing in long-term growth initiatives.
Technical Analysis and Stock Performance
The technical analysis of NASDAQ:EXPE reveals critical support and resistance levels, indicating potential price movements. The stock's recent recovery from the May low of $107.25 and the establishment of higher lows suggest underlying strength.
Key Technical Levels:
- Support Level: $107.25
- Resistance Levels: $140 and $160
The stock's ability to maintain these support levels and recover from earnings-related declines indicates resilience and potential for continued upward momentum.
Market Dynamics and Broader Economic Factors
Expedia's performance is influenced by broader market dynamics and economic factors, including travel demand recovery and geopolitical events. The recovery in U.S. and global travel markets, coupled with strategic adjustments, positions Expedia to capitalize on these trends.
Macro Factors:
- U.S. Travel Market: The recovery in travel demand is expected to benefit online travel agencies like Expedia.
- Geopolitical Events: Changes in travel regulations and geopolitical stability will influence market conditions and demand.
Summary and Investment Outlook
Expedia Group, Inc. (NASDAQ:EXPE) presents a compelling investment case amidst a recovering travel market and strategic realignments. Despite short-term challenges with Vrbo, the company's broader focus on hotel bookings, cost management, and strategic initiatives like the One Key rewards program position it for future growth. With an attractive forward P/E ratio and robust financial health, NASDAQ:EXPE offers significant potential for investors seeking exposure to the travel sector.
Investors should closely monitor insider transactions and broader market trends to make informed decisions. For real-time updates and detailed analysis, visit Expedia Stock Profile.