


FDVV vs. SCHD: Which Dividend ETF Wins on Growth, Yield, and Value in 2025?
SCHD offers a 3.57% yield, while FDVV rides the tech wave—Which ETF delivers the biggest returns? | That's TradingNEWS
NYSEARCA:FDVV vs. NYSEARCA:SCHD – Which Dividend ETF Offers Better Value and Growth?
Dividend Performance and Growth Potential – How Do NYSEARCA:FDVV and NYSEARCA:SCHD Compare?
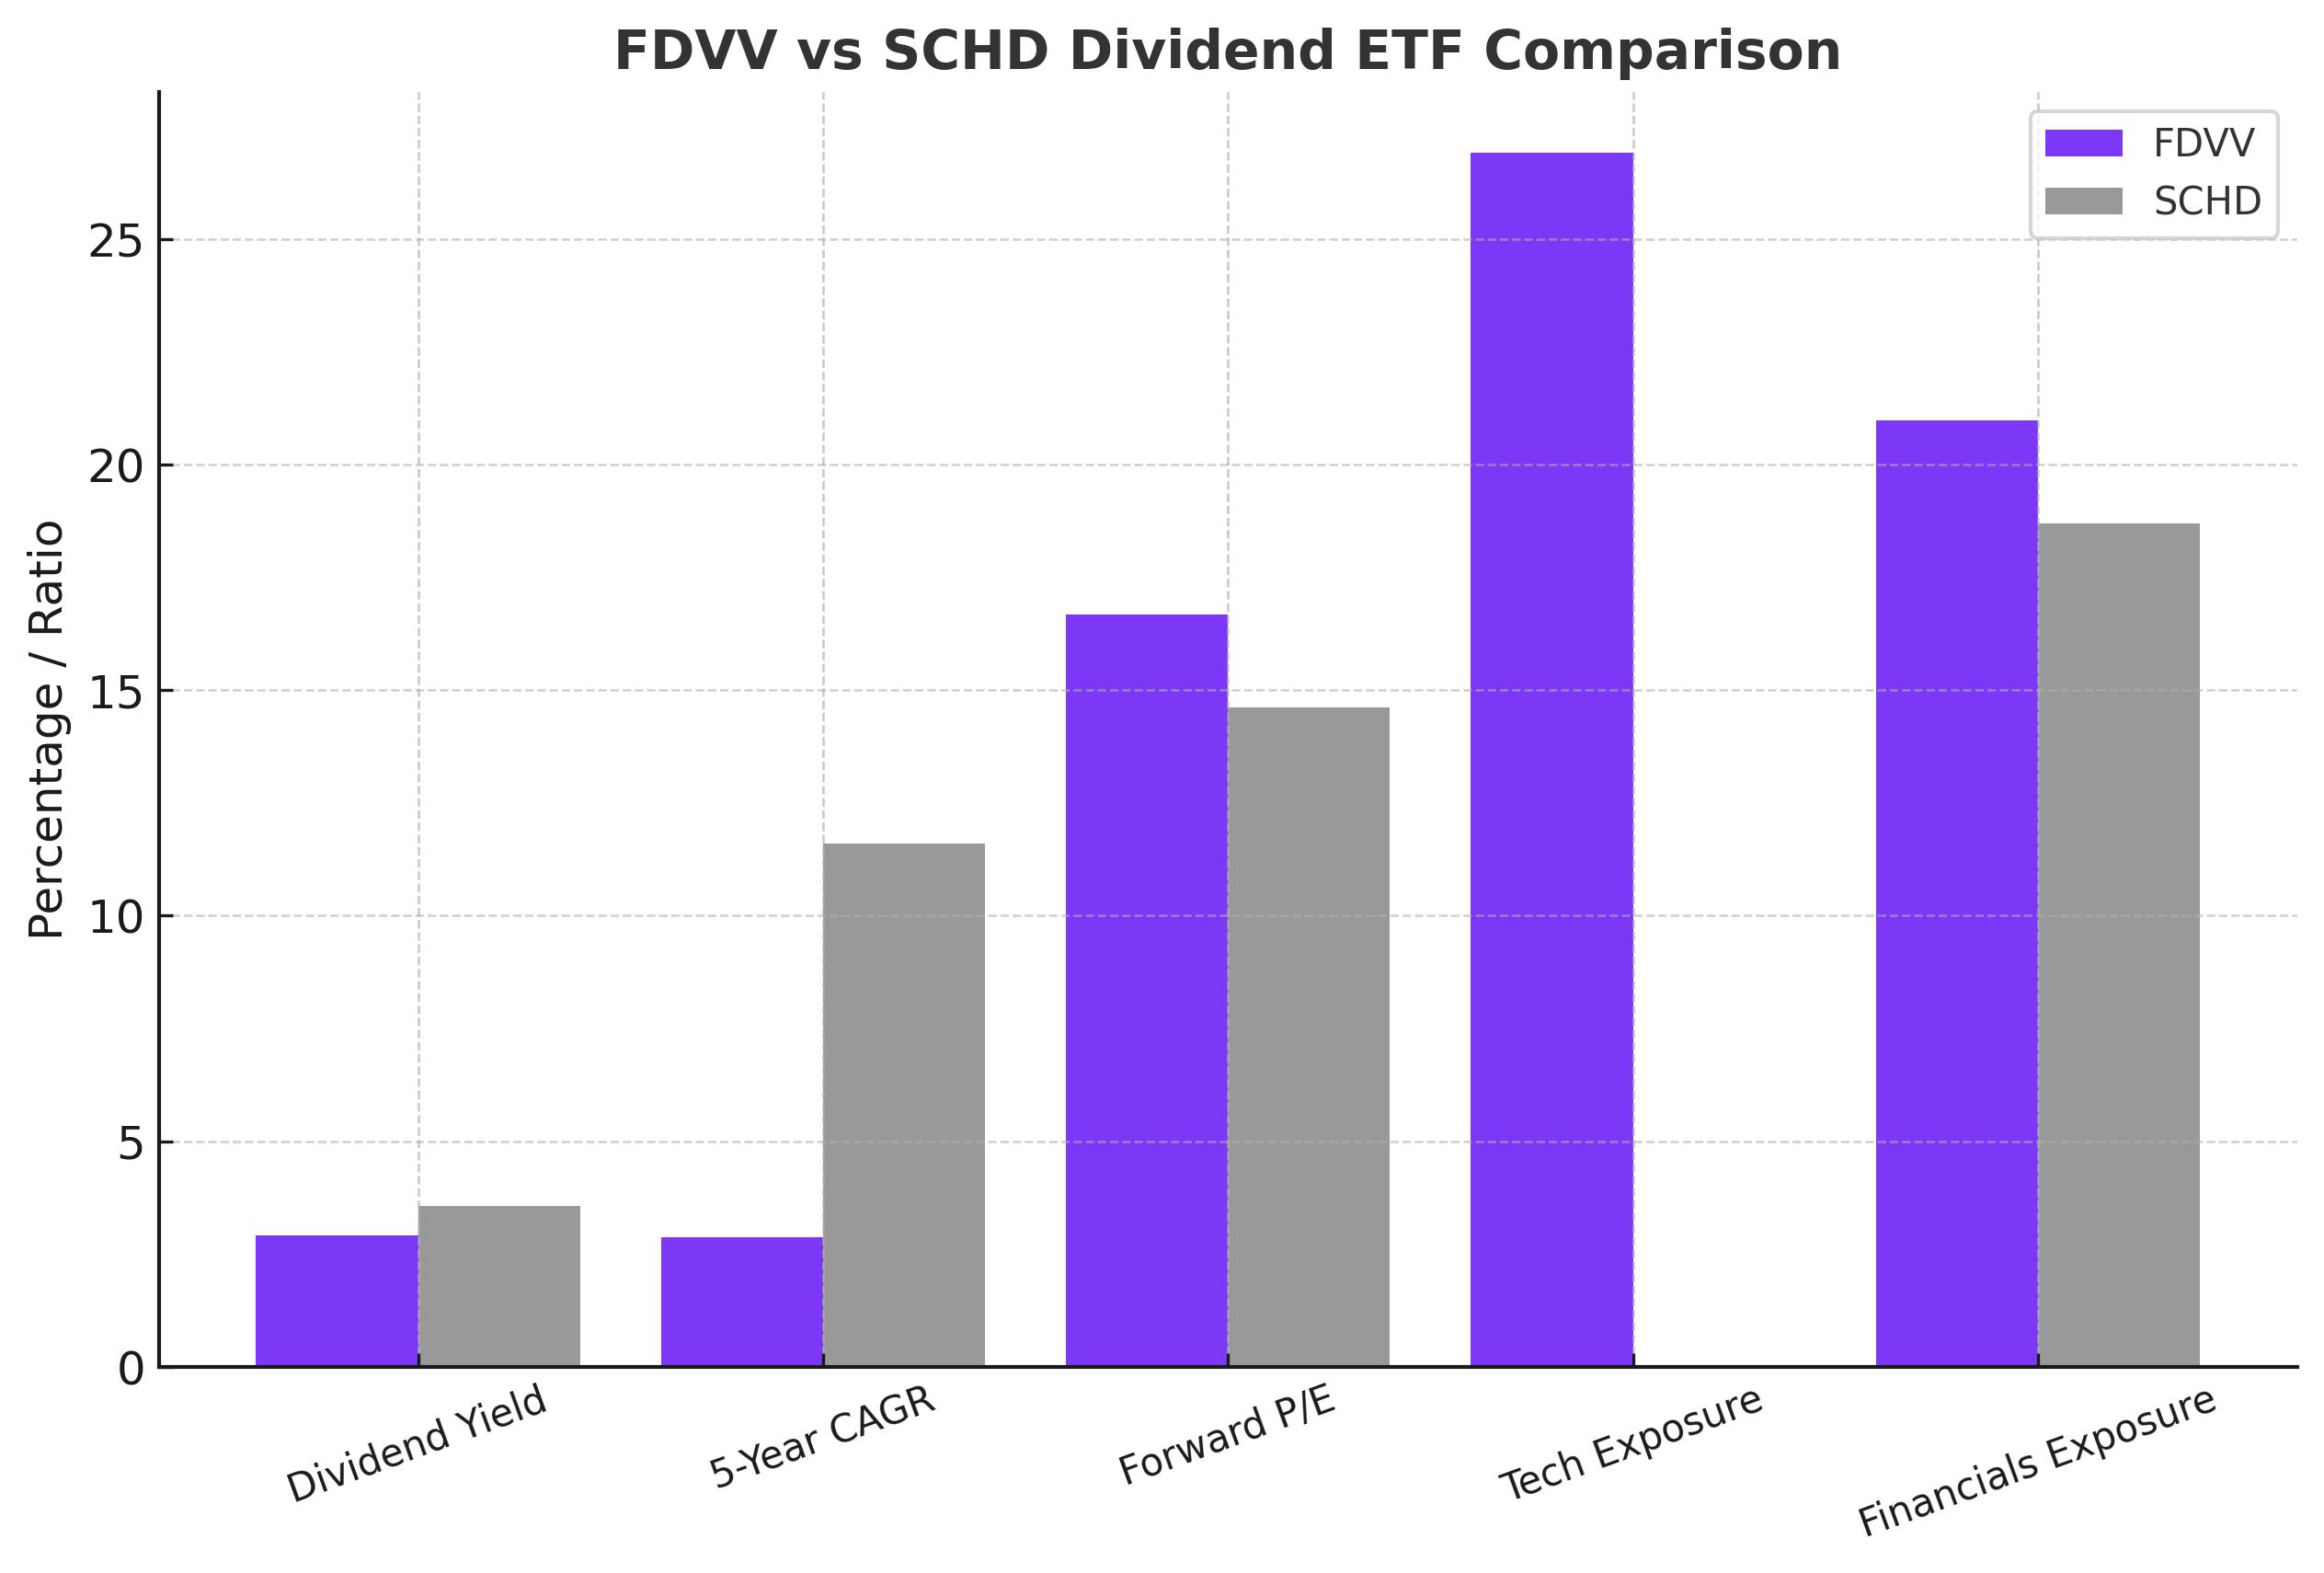
The debate between NYSEARCA:FDVV (Fidelity High Dividend ETF) and NYSEARCA:SCHD (Schwab U.S. Dividend Equity ETF) has intensified as investors seek the best combination of dividend yield, growth potential, and portfolio stability. Both ETFs cater to dividend-focused investors, but their sector allocation, yield growth, and valuation strategies differ significantly. With SCHD yielding 3.57% and FDVV offering 2.91%, the surface-level numbers suggest SCHD as the winner, but FDVV's exposure to technology stocks like NVIDIA (NVDA) and Apple (AAPL) gives it an edge in bull markets.
Over the past five years, SCHD’s dividend growth rate has outpaced FDVV’s by a wide margin, with a five-year CAGR of 11.59%, while FDVV lags behind with just 2.87% over the same period. FDVV, however, benefits from exposure to high-growth companies, which has led to stronger price performance in recent market cycles. Which ETF should long-term dividend investors favor?
Live Chart for NYSEARCA:FDVV
Live Chart for NYSEARCA:SCHD
Valuation Differences – Is SCHD Undervalued Compared to FDVV?
SCHD's excess CAPE yield relative to SPY (S&P 500 ETF) is at a decade-high level, signaling undervaluation. Historically, when SCHD’s yield spreads reach these levels, it has led to outperformance against the broader market. This suggests that SCHD is currently trading at a discount compared to other dividend-focused ETFs, making it a compelling buy.
Meanwhile, FDVV's P/E ratio has dropped from 18.00x to 16.68x, making it cheaper than its historical average but still more expensive than SCHD, which trades at a forward P/E of 14.62. FDVV’s recent index reconstitution added significant financial sector exposure, increasing its weighting in JP Morgan (JPM), Bank of America (BAC), and Blackstone (BX). These additions should enhance yield stability, but also introduce higher volatility given the cyclical nature of financial stocks.
SCHD, on the other hand, remains heavily weighted toward defensive sectors, including consumer staples, healthcare, and financials, with top holdings such as Pfizer (PFE), Coca-Cola (KO), and Amgen (AMGN). This makes SCHD less vulnerable to market downturns, while FDVV’s heavier tech exposure may lead to higher drawdowns during economic uncertainty.
Sector Exposure – FDVV’s Tech Dominance vs. SCHD’s Defensive Stability
One of the most striking differences between FDVV and SCHD is sector allocation. FDVV has a massive 26.92% exposure to technology stocks, while SCHD has minimal tech holdings. This makes FDVV an attractive option for investors who want dividend exposure while still benefiting from growth in AI and semiconductors.
FDVV’s top three holdings – NVIDIA (NVDA), Apple (AAPL), and Microsoft (MSFT) – account for nearly 18% of the fund, giving it a strong correlation to bull market cycles. However, if the market enters a correction or rate hikes persist, FDVV’s tech-heavy allocation could lead to significant underperformance.
SCHD, in contrast, leans toward defensive dividend stocks, which historically outperform in high-volatility environments. With major allocations in financials (18.7%), healthcare (16.7%), and consumer staples (14.4%), SCHD is built for dividend stability rather than aggressive growth.
The choice between the two ETFs comes down to risk tolerance – FDVV is better suited for investors who want dividend exposure with tech upside, while SCHD is the better pick for those prioritizing income stability and long-term value investing.
Dividend Yield and Growth – SCHD’s Long-Term Edge Over FDVV?
SCHD has been a dividend growth powerhouse, delivering consistent double-digit growth rates over the past decade. From 2017 to 2024, SCHD’s dividend income grew by 179%, nearly tripling investors’ annual payouts. FDVV, on the other hand, grew dividends by just 83% over the same period, failing to keep pace with SCHD’s compounding effect.
Another key advantage for SCHD is payout consistency. FDVV’s quarterly distributions fluctuate significantly, making it less predictable for income-focused investors. In contrast, SCHD’s dividend history shows a much more stable growth trend, making it a stronger choice for retirees and income-focused portfolios.
FDVV’s dividend growth weakness can be attributed to its heavy tech exposure, as most of its holdings prioritize share buybacks over dividend increases. For example, NVIDIA (NVDA) pays an insignificant 0.03% dividend yield, yet it remains FDVV’s largest holding. Investors seeking reliable dividend compounding would be better served by SCHD.
Historical Performance – FDVV’s Short-Term Advantage, SCHD’s Long-Term Strength
FDVV has outperformed SCHD in price appreciation over the past three years, benefiting from tech-led rallies. However, when measured over longer periods (5–10 years), SCHD has consistently delivered higher total returns, thanks to its superior dividend reinvestment compounding.
For example, in the 2022 market downturn, SCHD outperformed FDVV as defensive sectors held up better than tech stocks. If the Federal Reserve keeps interest rates higher for longer, SCHD’s defensive positioning could continue to outperform FDVV, as growth stocks struggle in high-rate environments.
Risk Factors – Can FDVV Continue Its Outperformance?
FDVV’s performance is highly correlated to tech sector momentum, meaning it could struggle if AI and semiconductor stocks take a hit. The recent Goldman Sachs report predicting a slowdown in S&P 500 earnings growth raises concerns about whether tech stocks can sustain their current valuation levels.
Moreover, FDVV’s increased financial sector exposure adds another layer of risk. If interest rates remain elevated or banking sector profits decline, FDVV could see underperformance compared to SCHD’s more diversified sector exposure.
On the other hand, SCHD’s primary risk is underperformance in strong bull markets. If AI-driven innovation continues at a rapid pace, SCHD’s lack of tech exposure could limit upside potential compared to FDVV. However, SCHD’s valuation remains far more attractive, with a forward P/E of 14.62 vs. FDVV’s 16.68, making it a safer option in uncertain economic conditions.
Final Verdict – Should You Buy NYSEARCA:FDVV or NYSEARCA:SCHD?
Both ETFs offer compelling reasons to be included in a portfolio, but the decision depends on an investor’s primary goal. If the objective is maximizing long-term dividend income and growth stability, SCHD is the clear winner. It has a higher yield (3.57% vs. 2.91%), superior dividend growth (11.59% CAGR vs. 2.87%), and better valuation metrics.
However, for investors willing to take higher risks in exchange for exposure to high-growth tech stocks, FDVV is the better option. Its heavy allocation to AI-driven companies like NVDA and AAPL means it could significantly outperform during strong bull markets.
Ultimately, if income stability and long-term compounding are the priority, SCHD is a strong buy. If the goal is a mix of dividend yield and growth potential, FDVV is a solid choice but comes with greater volatility risks.
Which ETF will emerge as the best performer over the next decade? That will depend on whether AI-driven tech growth sustains its momentum or if defensive dividend stocks make a strong comeback in uncertain economic times.